
How To Read Your Data With Google Analytics
So glad to have you back today for Part 2 of our Google Analytics series. I wanted to go over some of the basics reports generated from Google Analytics. In the last post, (click here if you missed it), I walked you through how to create an account in Google Analytics, grab the Tracking Code and add the tracking code to Squarespace.

Before I go on, I want to highlight one important point that it is so easy to fall into the trap of setting up Google Analytics and then forgetting about it. We get caught up with our day - to -day business tasks, content creation, promotions, launches you name, that we ignore the analytic side of things and then months later, wonder why we are not booking clients, making sales etc.
Trust me, I have made the same mistake as well. I can't stress how important it is to carve out a day in your week at minimum to look at your analytics. It doesn’t have to be a whole day, maybe a couple of hours. Why the fuss you might be thinking, well here are some good reasons why. By looking at your analytics, you can
Better market your products and services
Create in-demand content
Target your ideal clients
See pages are working and attracting visitors and what is not.
My advice is to schedule the time to make this happen. It will really take your game to a higher level. Again, if you need help setting up your Google Analytics, click here.
For now, I want to focus on some basic Google analytic reports that will help you get a general understanding of your data and what sort of information you can derive from it. Let’s get started:
1. Audience Reports
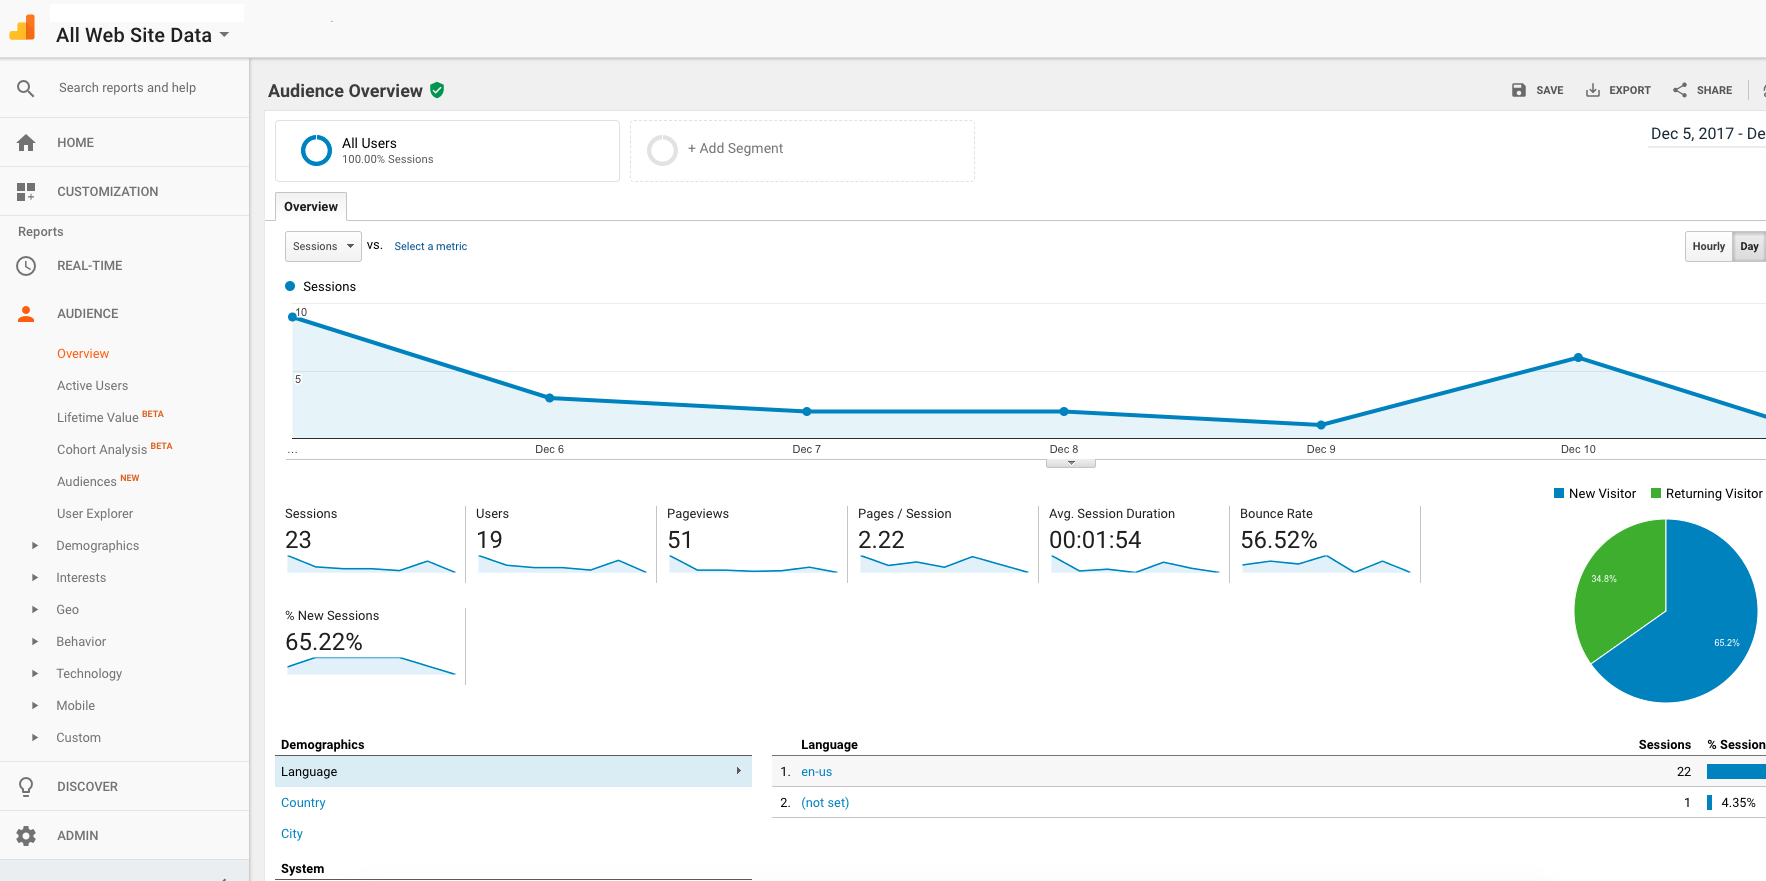
The Audience reports provide you with the characteristics of your visitors. It gives basic information on your active users over a period of time in hours, days, week and month. This is an overview of the makeup of the visitors that are coming to your site. Here are some definitions to help clarify what each section of the report means.
Sessions: This number represents the total number of times your site was visited over a certain time period. This number includes repeat visitors.
Users: This is the total number of people that visit your site over a specified time period.
Pageview: This number represents the total number of pages that were visited by users over a certain time period.
Avg. Session Duration: The average amount of time that each visitor remains on your site.
Bounce Rate: The percentage of visitors who navigate away from your website after landing on your homepage.
% of New Sessions: The percentage of people who are visiting your site for the first time.
2. Real-Time Report
The real-time report overview provides you with details on how many visitors are currently on your site. This is real-time data that actively changes as visitors come to your site and leave your website. I love this report because it gives me a general sense of where my visitors are navigating to and how long they are staying on my site. I can also see from where they came from (mobile, search engine etc) to where in the world they are coming from, cool right! Take some time and see how your stats are doing in real time. I think the one items that is also very useful is to know the top keywords your visitors are using to find you.

Here are some definitions to help clarify what each section of the report means.
3. Acquisition report

The Acquisition report provides you with details on how you are getting your visitors. That is how they come to your site, what do they do when they come to your site and their conversion behaviors. Google categorizes this report into 5 areas, Direct, Referral, Organic Search, Social and Other. In this report, you get a good sense of where your visitors are coming from.
Below is a summary of terms that you might find helpful in understanding the term:
Direct: This number refers to the number of people who simply type your URL into their browser and visit your site directly.
Referral: This category refers to sites that have direct links to your site, referring traffic to you. This is great for networking with other creatives. Being able to view those who are linking to you allows you to network by visiting their site, leaving a comment, sharing the post on social media, etc.
Organic Search: This report shows you how people are discovering your website through search engines. By viewing this data, you have the ability to see which keywords you should be focusing on and using more often in order for a greater number of people to come across your site.
Social: The number of click-throughs on your site from social media.
Bounce Rate: This is KEY and sometimes a little confusing. A bounce is when a visitor comes to your site and lands on one page and leaves your site from the SAME page. That means that your visitor is not exploring your site and quickly decides to leave your website. This tells Google that your website did not have the information the visitor was searching for. So If your bounce rate is high that is a bad thing. That means no one is staying on. So it is important to figure out how to ensure your bounce rate is low. The ideal bounce rate should be below 40%. The lower the better.
Google Analytics is a very robust tool and has many more potential than just these three reports. The 3 reports that I mentioned in this blog will give you a general overview of the traffic coming to and leaving your website. You will understand who your visitors are, where they are coming from, what they seem to gravitate to, how long they are on your website. This data will help you strategize how to effectively market your products and services and keep your reader coming back for more.
Hope you found this helpful.
Do you have a favorite Google Analytics report you like to use? Please share.